
From creating pie charts and timelines to ‘anatomy’ and ‘evolution’ types of data representation, the infographic provides a good look at how you can think and present your ideas.
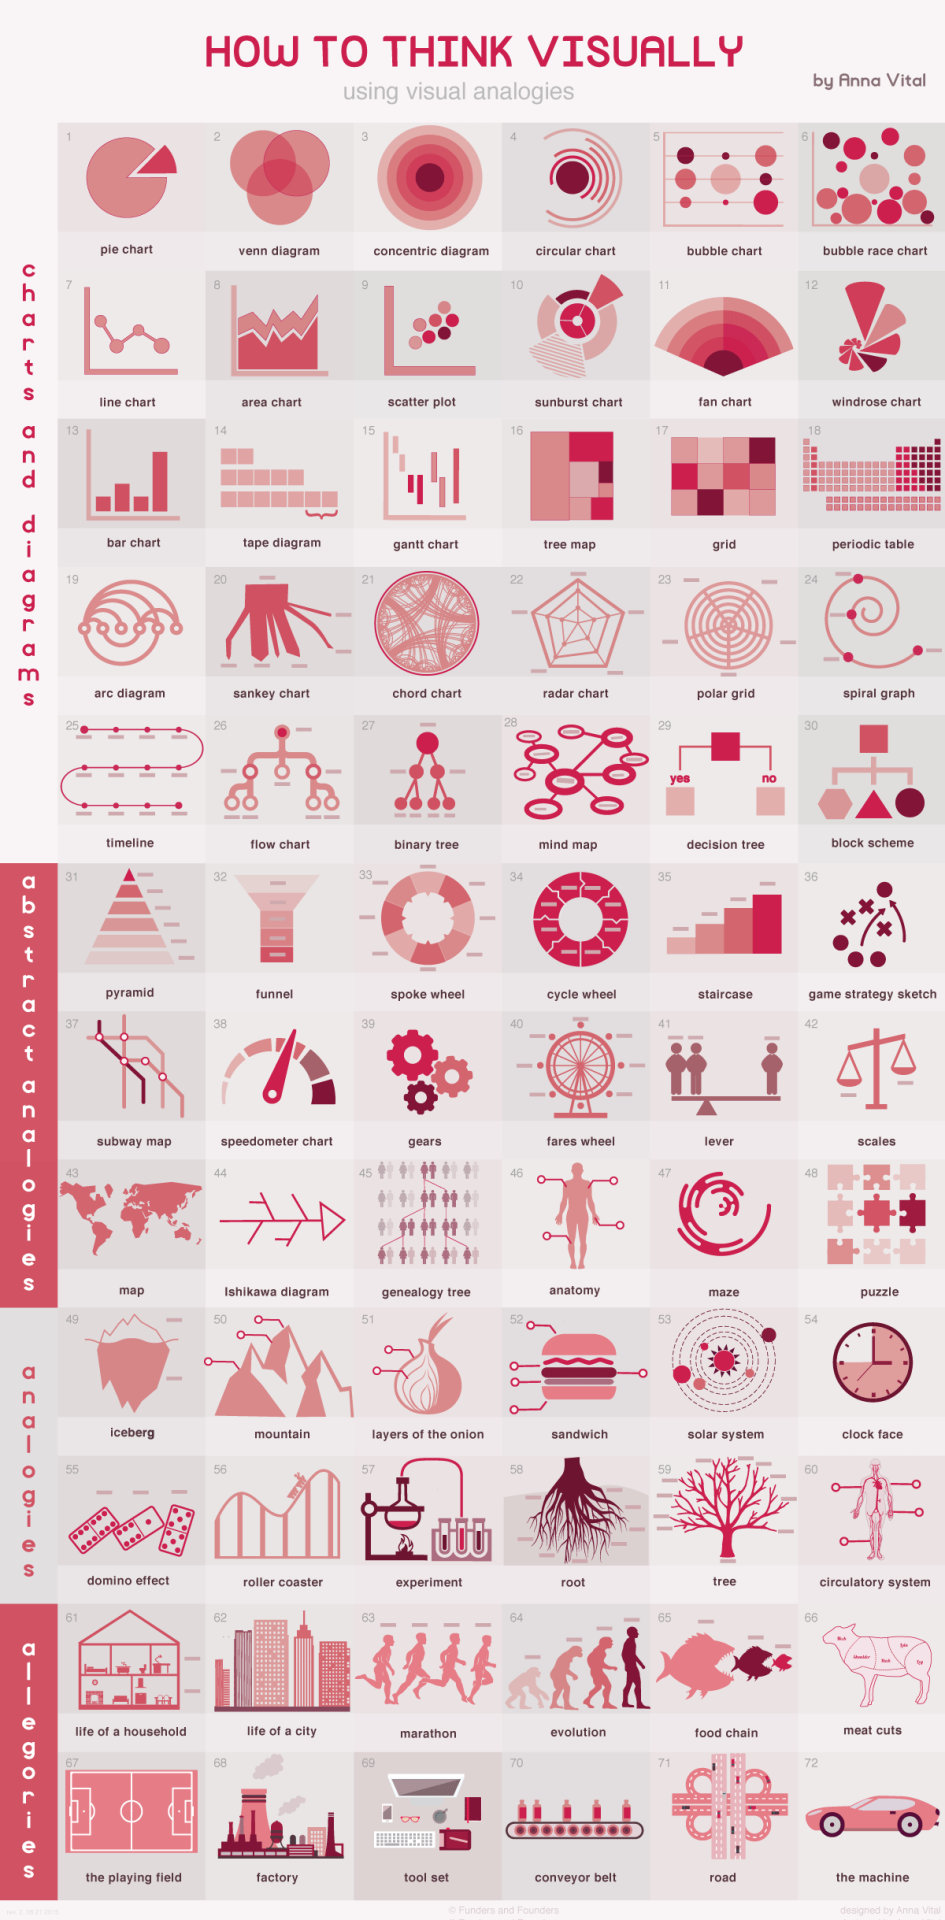
by Anna Vital
Comments


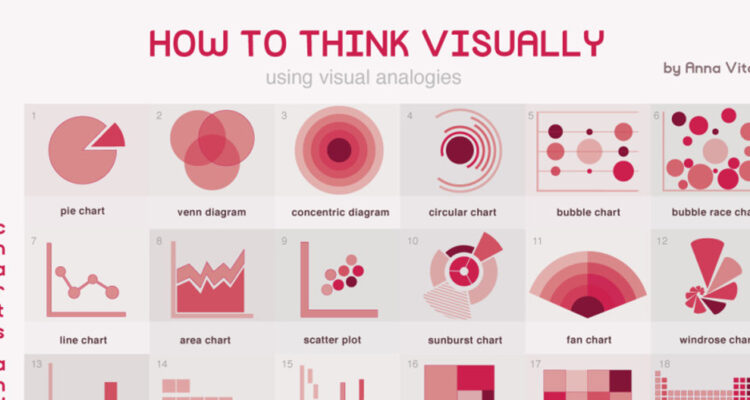
From creating pie charts and timelines to ‘anatomy’ and ‘evolution’ types of data representation, the infographic provides a good look at how you can think and present your ideas.
by Anna Vital